I have used the mesh in the following link. 2024_02_05_helix.msh
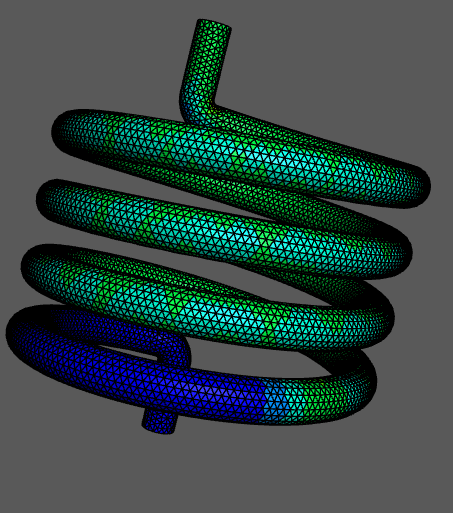
This is a coil model, and I expect the current to flow from top to bottom.
However, it stops in the middle, as shown in the attached figure.
When I make the mesh coarse, it becomes better.
Does anyone know why?
from netgen.read_gmsh import ReadGmsh
from netgen.meshing import *
netgen_mesh = ReadGmsh("2024_02_05_helix.msh")
import ngsolve
from ngsolve import *
mesh = ngsolve.Mesh(netgen_mesh)
from ngsolve.webgui import Draw
#Draw(mesh)
print(mesh.GetMaterials())
print(mesh.GetBoundaries())
fes = H1(mesh, definedon=[1,2,3,4,5], order=1, dirichlet='plus|minus')
print(fes.ndof)
sig = mesh.MaterialCF({"conductor" : 1})
u = fes.TrialFunction()
v = fes.TestFunction()
a = BilinearForm(fes, symmetric=True)
a += SymbolicBFI(grad(u)*sig*grad(v))
a.Assemble()
f = LinearForm(fes)
f.Assemble()
gfu = GridFunction(fes)
gfu.Set(1, definedon=mesh.Boundaries("plus"))
c = Preconditioner(a, "local")
solvers.BVP(bf=a, lf=f, gf=gfu, pre=c, tol=1e-13, print=False, maxsteps=1000)
J = grad(gfu)
Draw(J, mesh)