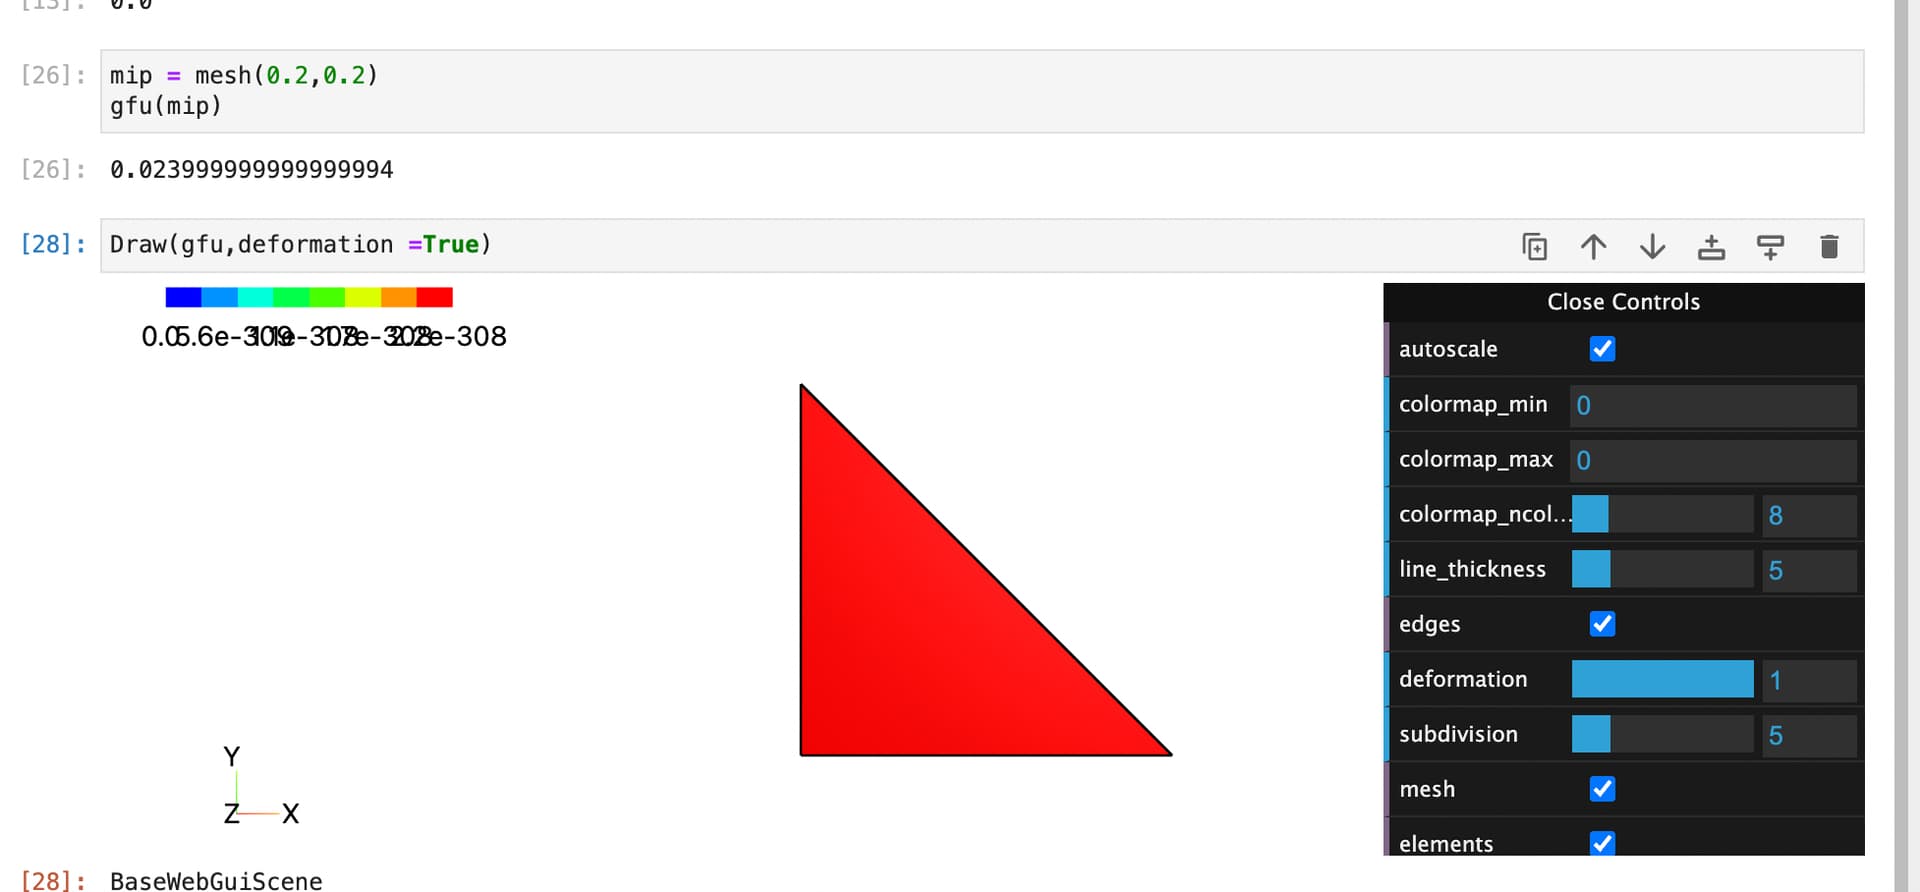
As figure showing, for a non-zero gfu GridFunction, the figure is zero everywhere. How to solve it? Thanks!
can you post the example? my guess is increase the subdivision for drawing or/and draw higher order. and probably set min/max manually
I would like to see the shape of the basis functions for high order finite elements on the following reference 2D triangle domain:
import netgen.geom2d as geom2d
geo = geom2d.SplineGeometry()
p1 = geo.AppendPoint (0, 0, name = "1")
p2 = geo.AppendPoint (1,0, name ="2")
p3 = geo.AppendPoint (0,1, name ="3")
geo.Append (["line", p1, p2], bc = "bottom")
geo.Append (["line", p2, p3], bc = "slope")
geo.Append (["line", p3, p1], bc = "vertical")
mesh_size = 1
mesh = Mesh(geo.GenerateMesh(maxh = mesh_size))
for 3 order finite element space(10 dofs):
fes = H1(mesh, order = 3)
I want to draw the interior basis function corresponding to COUPLING_TYPE.LOCAL_DOF
gfu.vec.data[9] =1
Draw(gfu)
The above figure was from these codes. Many thanks!