Thanks a lot for the feedback. I was a able to get pretty nice results with approach: eval on a grid and then plot with Matplotlib:
Here are the main steps. The key idea to get values on a 2D grid is to flatten the numpy coordinate arrays:
import numpy as np
import matplotlib.pyplot as plt

# eval on a 2D mesh grid
n = 101
x_lin = np.linspace(0.035, 0.065, n)
y_lin = np.linspace(0.035, 0.065, n)
X, Y = np.meshgrid(x_lin, y_lin)
Xshape = X.shape # save shape
Xf = X.reshape(-1) # flatten
Yf = Y.reshape(-1) # flatten
a_XY = a_gfu(mesh(Xf, Yf))
a_XY = a_XY.reshape(Xshape) # back to 2D
# same for B, but needs to handle the fact it's a vector → compute magnitude
B_XY = B(mesh(Xf, Yf)) # shape (n², 2)
Bnorm_XY = np.sqrt(B_XY[:,0]**2 + B_XY[:,1]**2)
Bnorm_XY = Bnorm_XY.reshape(Xshape) # back to 2D
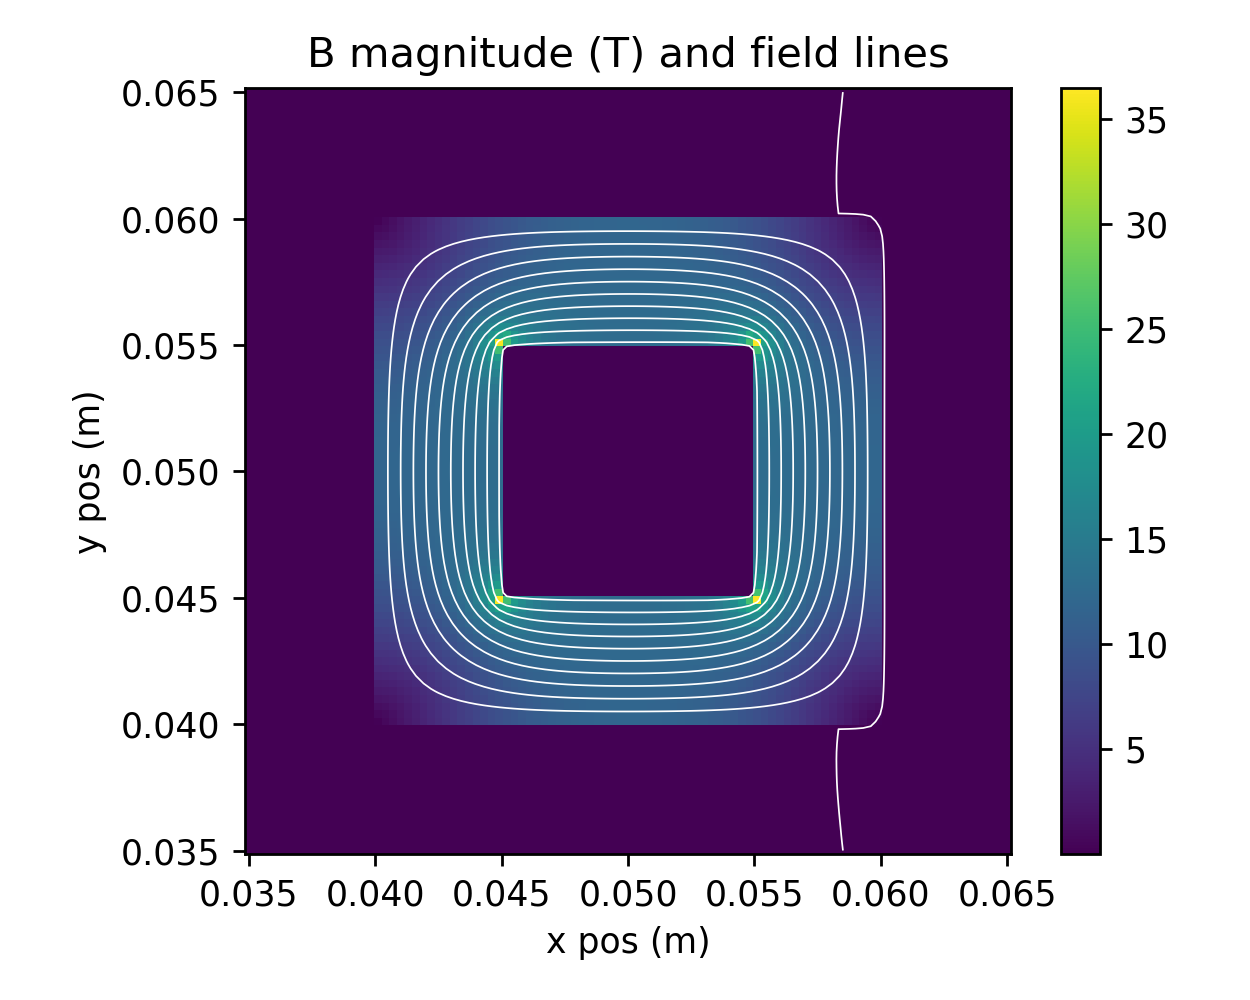
then here is a plot mixing field lines with B intensity as a colormap
fig, ax = plt.subplots(figsize=(5,4), subplot_kw=dict(aspect='equal'))

im = ax.pcolormesh(X, Y, Bnorm_XY)
fig.colorbar(im, ax=ax)
ax.contour(X, Y, a_XY, levels=10, colors='white', linewidths=0.5) # fix color, otherwise its colored by A

ax.set(
    title = 'B magnitude (T) and field lines',
    xlabel='x pos (m)',
    ylabel='y pos (m)',
)
fig.tight_layout()
Also thanks @christopher for your feedback. I took the “path of least unknown” and kept webgpu for another day!