Hi,
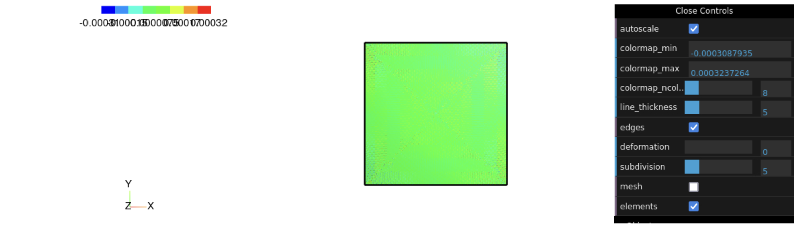
I have a problem with the scale of the color map when using the Draw function. In particular, when I plot the error (which is almost 0) I get an overlap of numbers in the scale (see attached picture). I tried to modify a little bit setting max, min and deformation but I wasn’t able to solve the problem. I would like to reduce the numbers in order to avoid that, or simply to write with powers of ten instead of having these very little numbers.
Has anyone an idea how to do that?
Bests,
Melanie