I have generated one tetrahedron element.
from netgen.csg import Pnt
from netgen.meshing import Element3D, Element2D, MeshPoint, FaceDescriptor, Mesh
mesh = Mesh()
mesh.dim = 3
dom = {}
dom[1] = mesh.Add(FaceDescriptor(bc=1,domin=1,surfnr=1))
v = []
v.append(mesh.Add(MeshPoint(Pnt(0,0,0))))
v.append(mesh.Add(MeshPoint(Pnt(1,0,0))))
v.append(mesh.Add(MeshPoint(Pnt(0,1,0))))
v.append(mesh.Add(MeshPoint(Pnt(0,0,1))))
mesh.Add(Element2D(dom[1], [v[0],v[1],v[2]]))
mesh.Add(Element2D(dom[1], [v[0],v[1],v[3]]))
mesh.Add(Element2D(dom[1], [v[1],v[2],v[3]]))
mesh.Add(Element2D(dom[1], [v[2],v[0],v[3]]))
mesh.Add(Element3D(dom[1], v))
import ngsolve
mesh = ngsolve.Mesh(mesh)
When I draw the function like
from ngsolve import *
fes1 = H1(mesh, order=3)
gfA = GridFunction(fes1)
ndof=fes1.ndof;
print([ndof])
from ngsolve.webgui import Draw
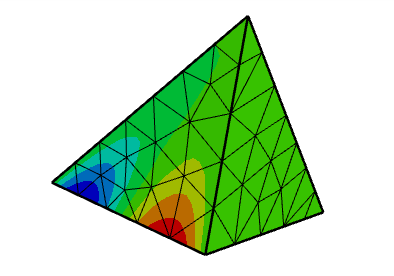
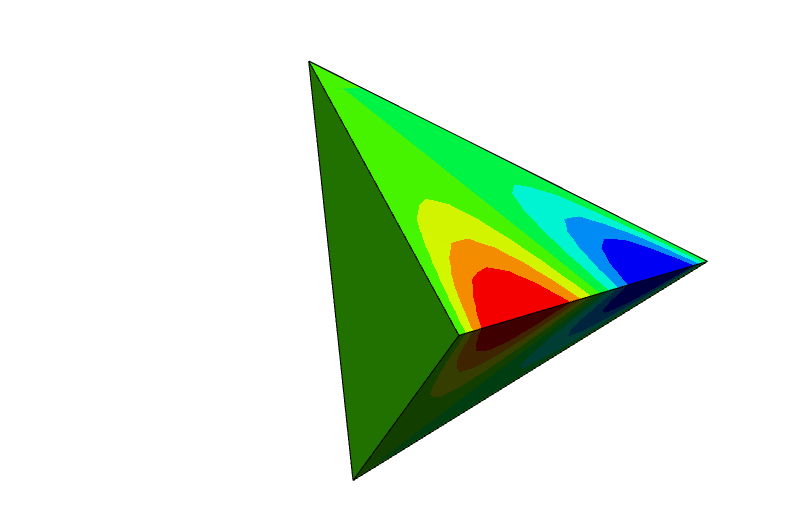
for m in [4,5]:
print("Shape function ", m)
gfA.vec[:] = 0
gfA.vec[m] = 1
Draw (gfA)
We can see contour plots when m=4, but not m=5. Are there any reason for this?