Hi,
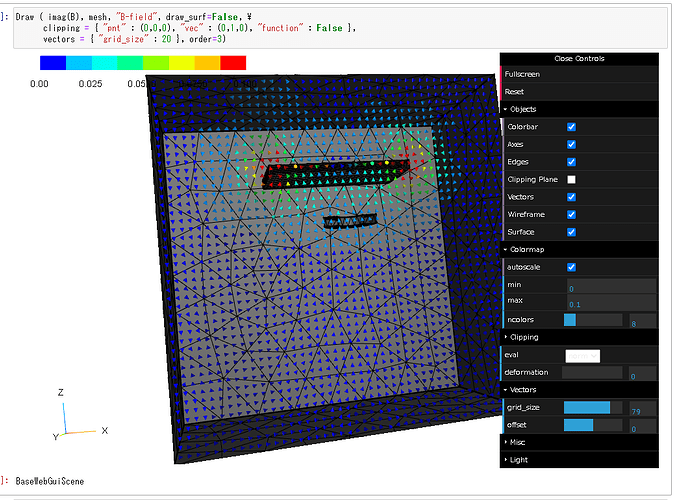
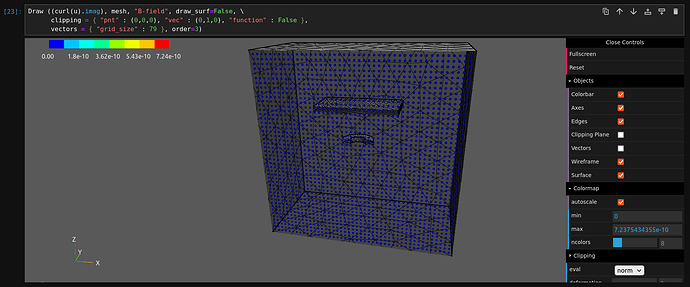
I’m trying to solve for the magnetic field in time harmonic Maxwell’s for low frequency (50 Hz). I have a coil with alternating current and above the coil I have a metal plate, from which I want to get the magnetic field from the induced eddies. The solution I get does not look as expected, but I’m not sure what my error is.
I have started from this example Maxwell Equations — NGS-Py 6.2.2402 documentation
which is a magnetostatic case. I then changed the magnetostatic equation
\int \mu^{-1} \operatorname{curl} u \operatorname{curl} v = \int j v,
to the time harmonic for low f:
\int i \omega\sigma uv + \int \mu^{-1} \operatorname{curl} u \operatorname{curl} v = \int j v
I also changed the finite element space to nograds=False and added complex = True:
fes = HCurl(mesh, order = 3, dirichlet=“outer”, nograds = False, complex = True)
I hope that someone can find my error or perhaps provide a similar example. My file is attached.
/Richard
maxwell_coil_AC.ipynb (5.5 KB)
I could not find any mistaake in your model.
1 Like
My solution looks different, or maybe I make some mistake when I plot the solution. Is your imag(B) the same as my curl(u).imag?
Thanks!
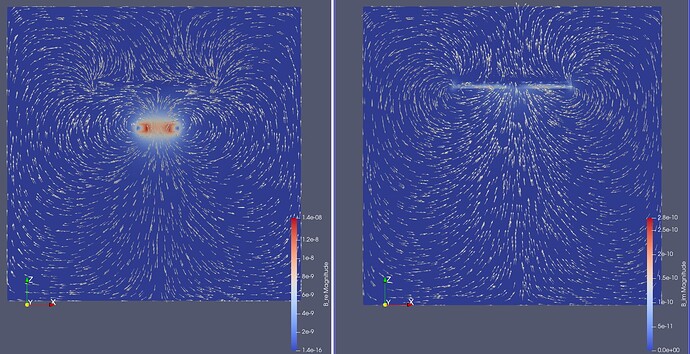
I exported the results to vtk and plotted in paraview and then it looks fine, but still I would be happy to know what mistake I made when plotting in jupyter.
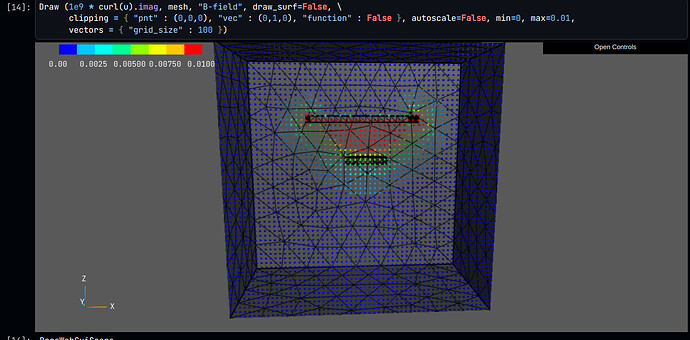
Ah, there seems to be an issue with small values and complex values in vector plots in the webgui. As a workaround you can draw real and imaginary part of B field in uT or nT:
Draw (1e9 * curl(u).imag, mesh, "B-field", draw_surf=False, \
      clipping = { "pnt" : (0,0,0), "vec" : (0,1,0), "function" : False }, autoscale=False, min=0, max=0.01,
      vectors = { "grid_size" : 100 })
1 Like


