Visualization issues of NGSolve

Hello everybody,

I am new to NGSolve. I’m currently learning about the force loading methods in NGSolve, but I can’t visualize the magnitudes and directions of forces, moments, and constraints. Could you provide me with the relevant syntax for reference? I’m compiling in Jupyter.

Thanks!
Best,
Max

Hi,

Can you provide a minimal example of what you have and what you would like to get? If you are using the webgui you should easily be able to visualize deformation fields and their magnitude if they are proper CoefficientFunctions.
Not sure which kind of visualization you expect for constraints, etc…

Best,
Christoph

Hello, sorry for replying so late. My question is:

For example1.1 First NGSolve example — NGS-Py 6.2.2505 documentation

f = LinearForm(fes)
f += x*v*dx
f.Assemble();

Is visually represented as:

However, for such loads, can the direction of force application be displayed in the form of arrows, just like in Abaqus?


Thank you so much.
Max

Hi,

Have you tried

Draw(gfu, settings={'Objects': {'Vectors': True}}) 

to see if it’s what you’re looking for?

You can also turn off the surface and mesh using

Draw(gfu, settings={'Objects': {'Vectors': True, 'Wireframe': False, 'Surface': False}})

Best regards

Hi,
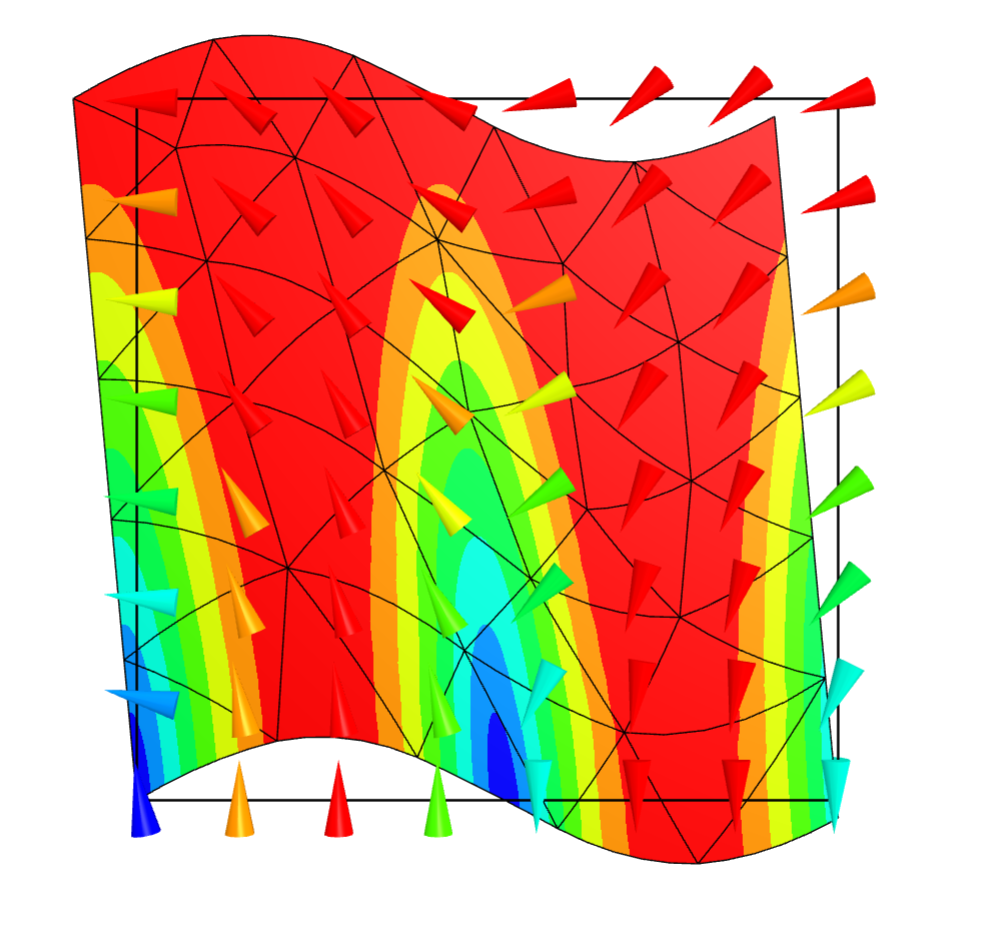
I’ve noticed that code like this can display arrows, and many visualization elements can be adjusted through settings. For example, the following code:

vecfun = CF((-y, sin(6*x)))   # CF = CoefficientFunction
Draw(vecfun, mesh, vectors=True);


Then the next question is: how can loads in the form of BilinearForm or LinearForm also be displayed via arrows?

f += 20 * x * y ** 2 * v * dx
f+=SymbolicLFI(InnerProduct(force_1, n) * v, definedon=mesh.Boundaries('top'))
region0 = IfPos(x - L + 1e-6, 1, 0)
force0 = CF((0, 0, 4))*region0
bfa += Variation(-par*force0* u * ds(element_boundary=True))

Thanks,
Max